 Audit Logs
Available on: Enterprise Edition
How to use Audit Logs to govern activities in your Kestra instance.
What are Audit Logs
Audit Logs record all activities performed in your Kestra instance by users and service accounts. By reviewing Audit Logs, system administrators can track user activity, and security teams can investigate incidents and ensure compliance with regulatory requirements.
Why are Audit Logs important
The audit log table in Kestra serves as a historical record that developers and system administrators can use to track changes, monitor system usage, and verify system activity. It's a transparency tool that helps in understanding the sequence of activities, ensuring accountability for actions taken, and providing data for troubleshooting and analysis. Given that Audit Logs are immutable, they can also be used to detect and investigate security incidents. If you leverage Kestra edition with Elasticsearch backend, you can also use Kibana to search and visualize your logs.
How to access Audit Logs
You can access Audit Logs from the Administration section in the UI. That UI page provides a detailed table of recorded events, capturing the actions taken within the system:
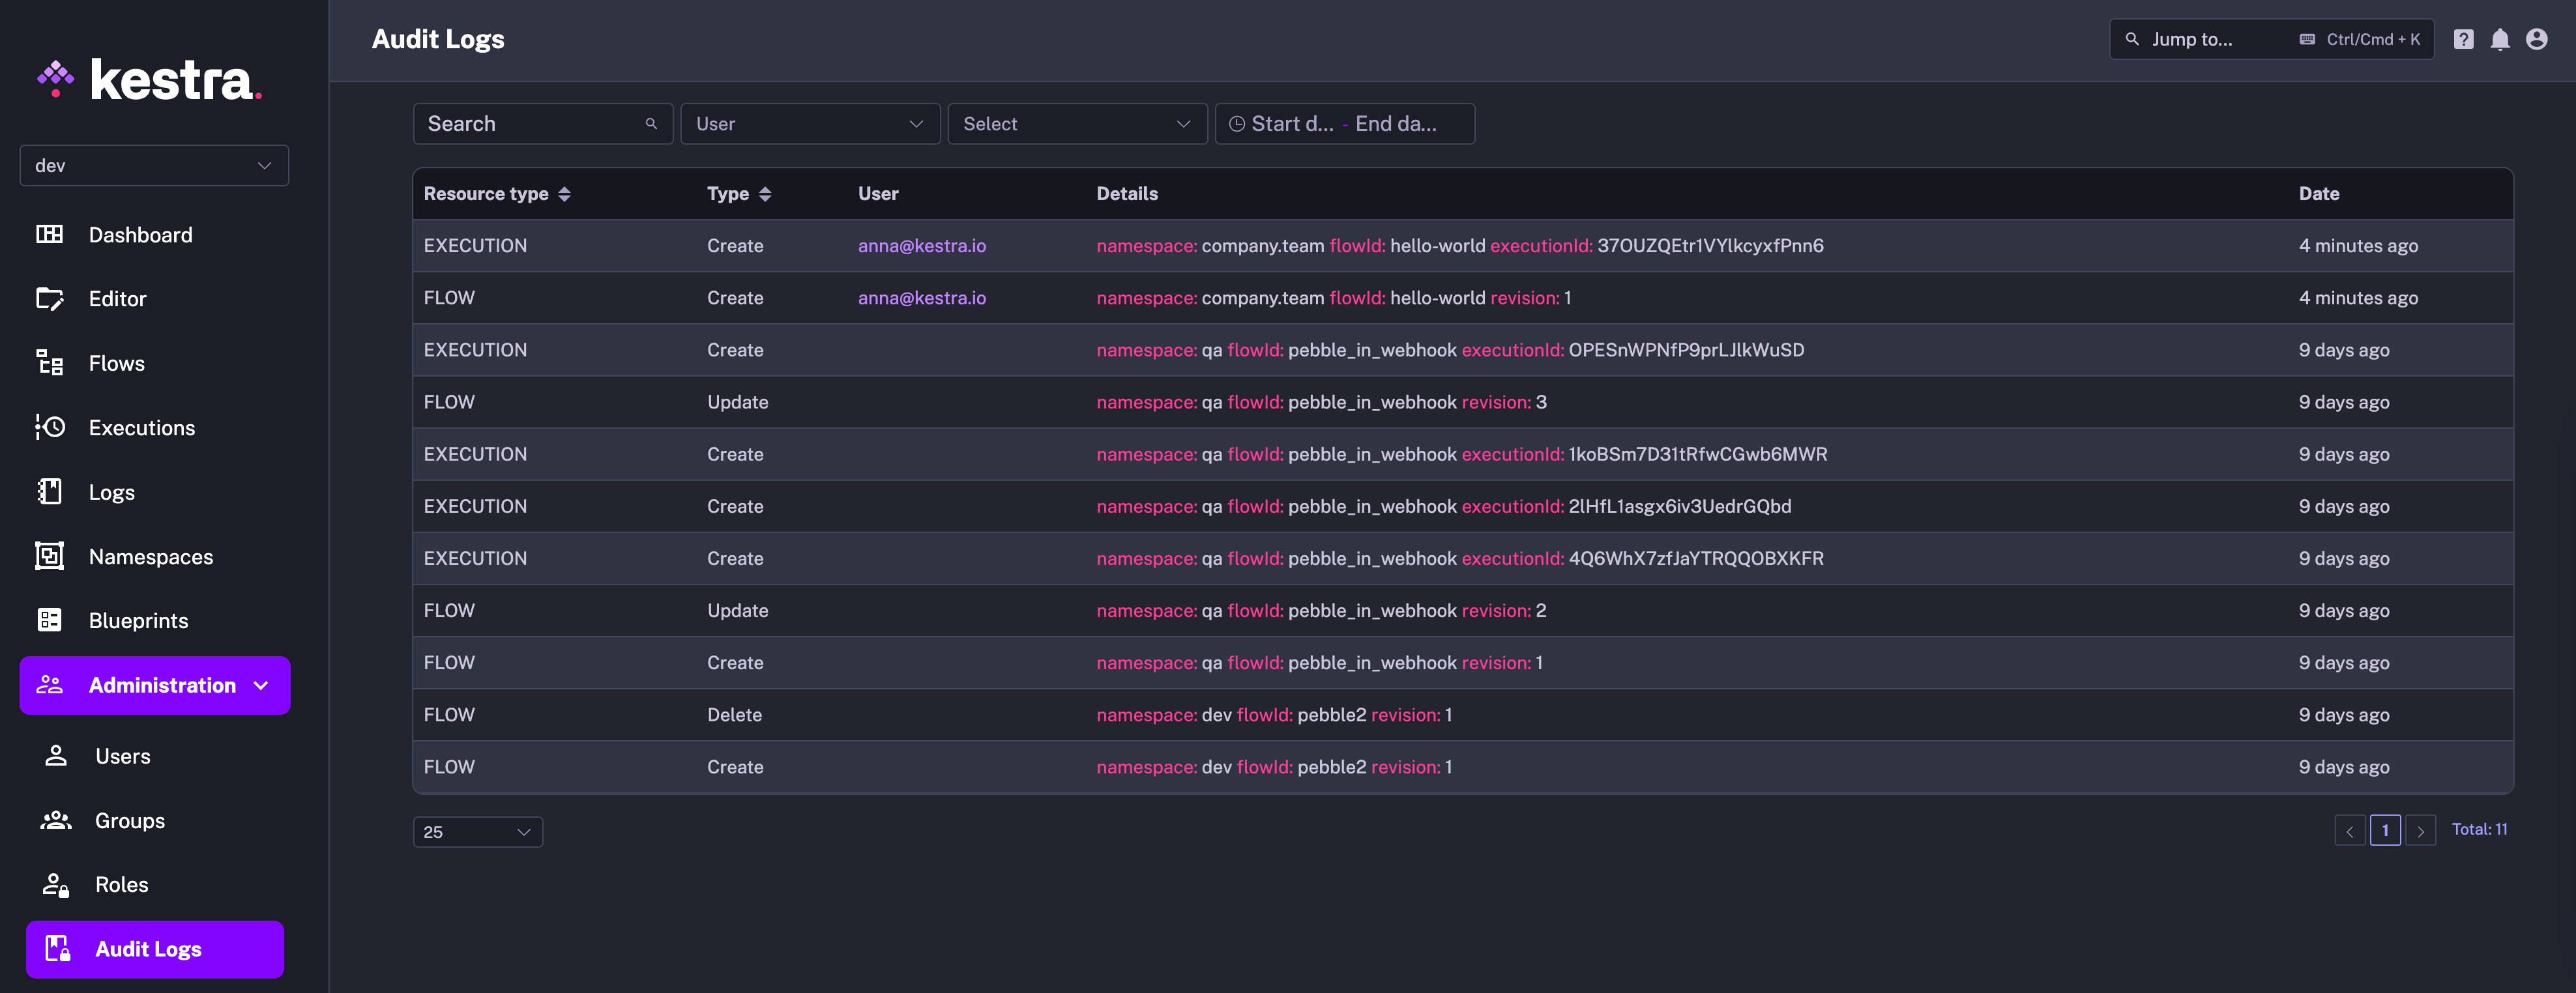
Each row in the table represents a distinct event with several columns providing specific details:
- Resource Type column categorizes the resource that the event is associated with, such as editing a flow (FLOW) or executing it (EXECUTION).
- Changes indicates whether a given resource has been created, updated, or deleted.
- Actor identifies who performed the action. The user can be a human, system or a service account.
- Details section offers an in-depth description of the event, including identifiers such as the
id,namespace,flowId,executionId, revision, etc. — those fields depend on the type of resource the event is associated with. - Date represents the timestamp of when the event occurred.
How to see a full diff of a specific event
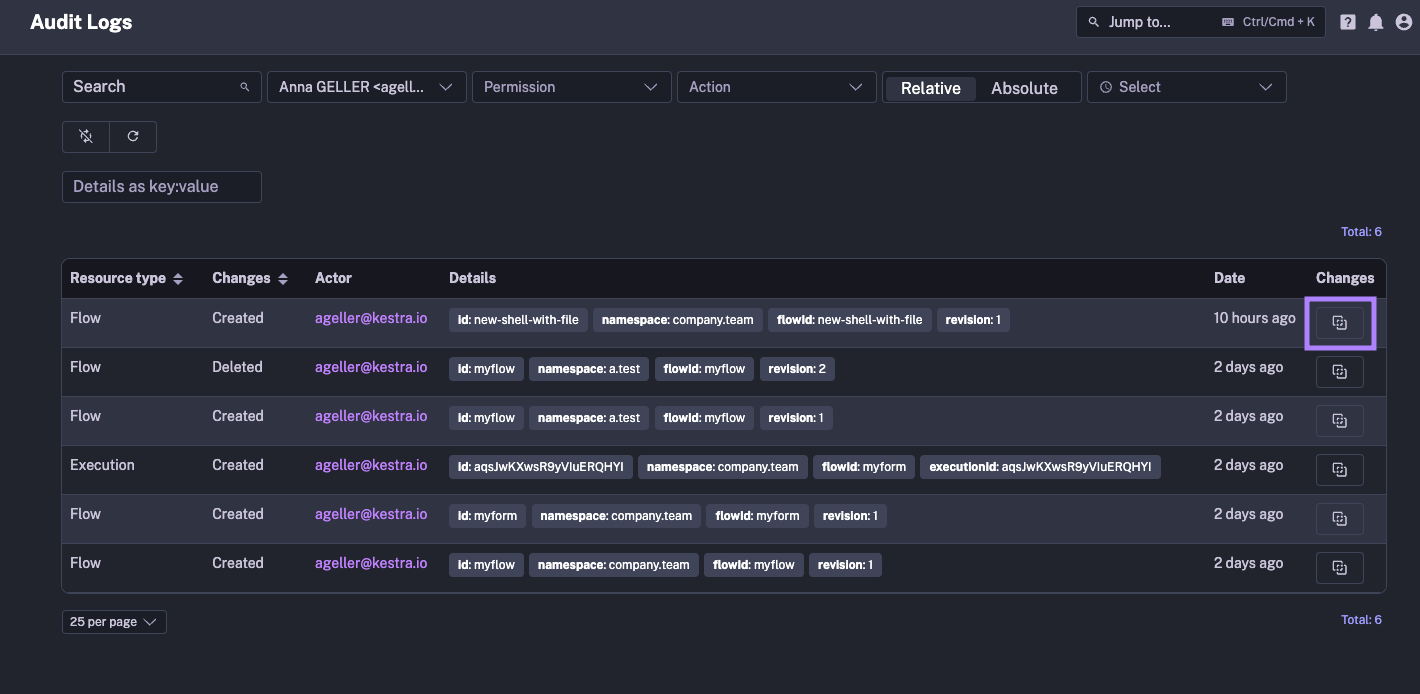
To see a full diff of a specific event, click on the icon at the end of each row to expand the details. The expanded view will show the full diff of the event side-by-side, including the before and after states of a given resource:
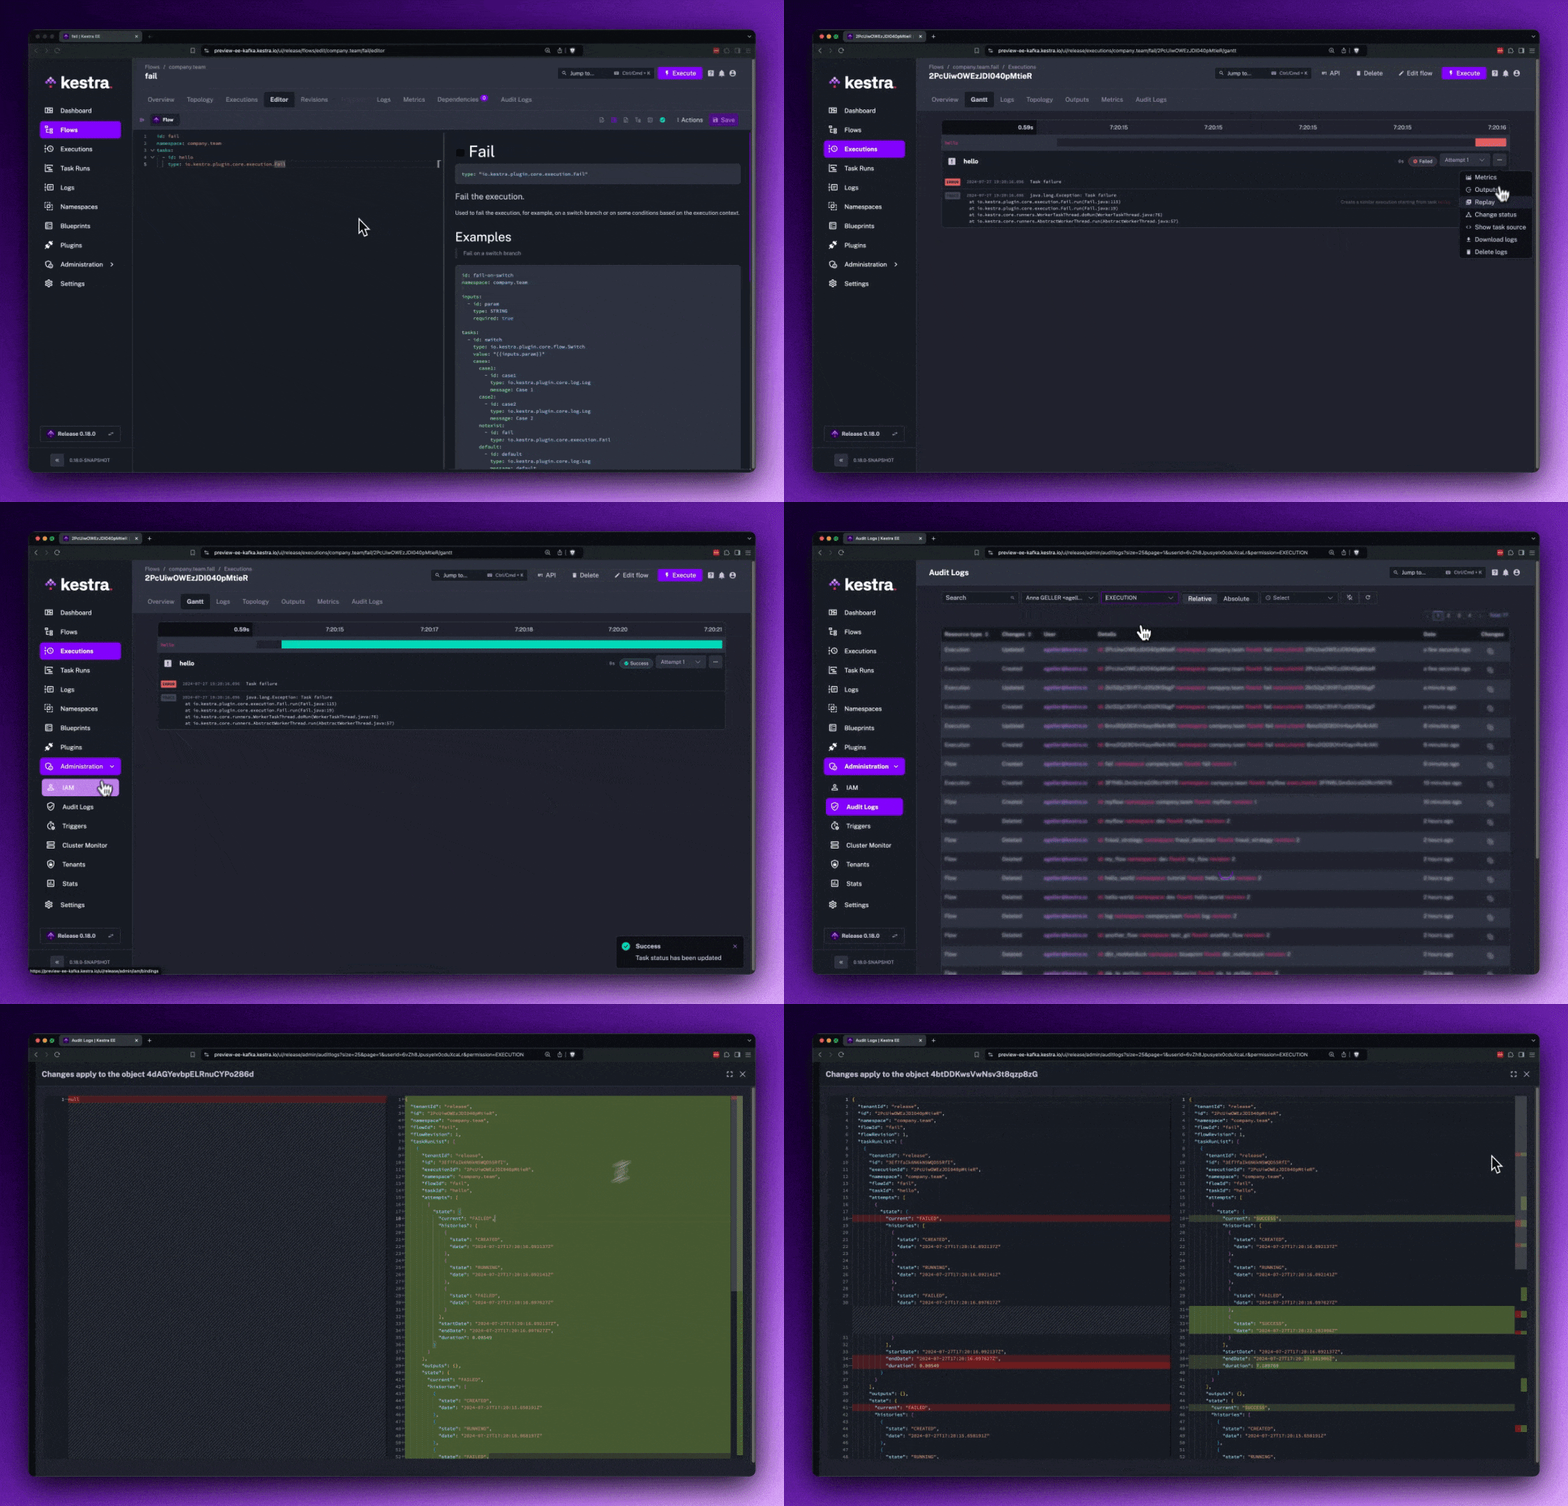
Below is an example where we manually change the Execution state from FAILED to SUCCESS and the diff shows the exact change made to the Execution:
How to use the Details filter to search for specific Audit Log events
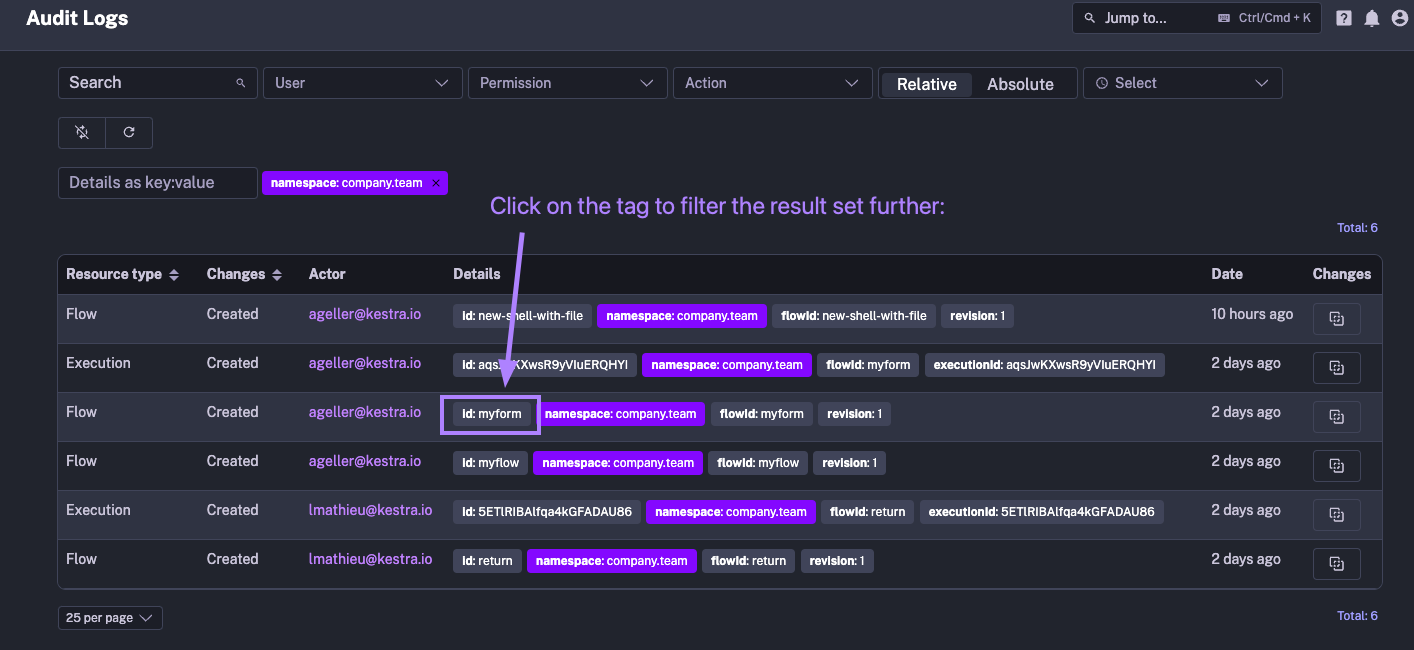
The Details filter allows you to flexibly search for any Audit Log event using the key:value format. It's a tag-based system which works the same way as Execution Labels.
For example, you can filter for all events related to a specific namespace by typing namespace:your_namespace:
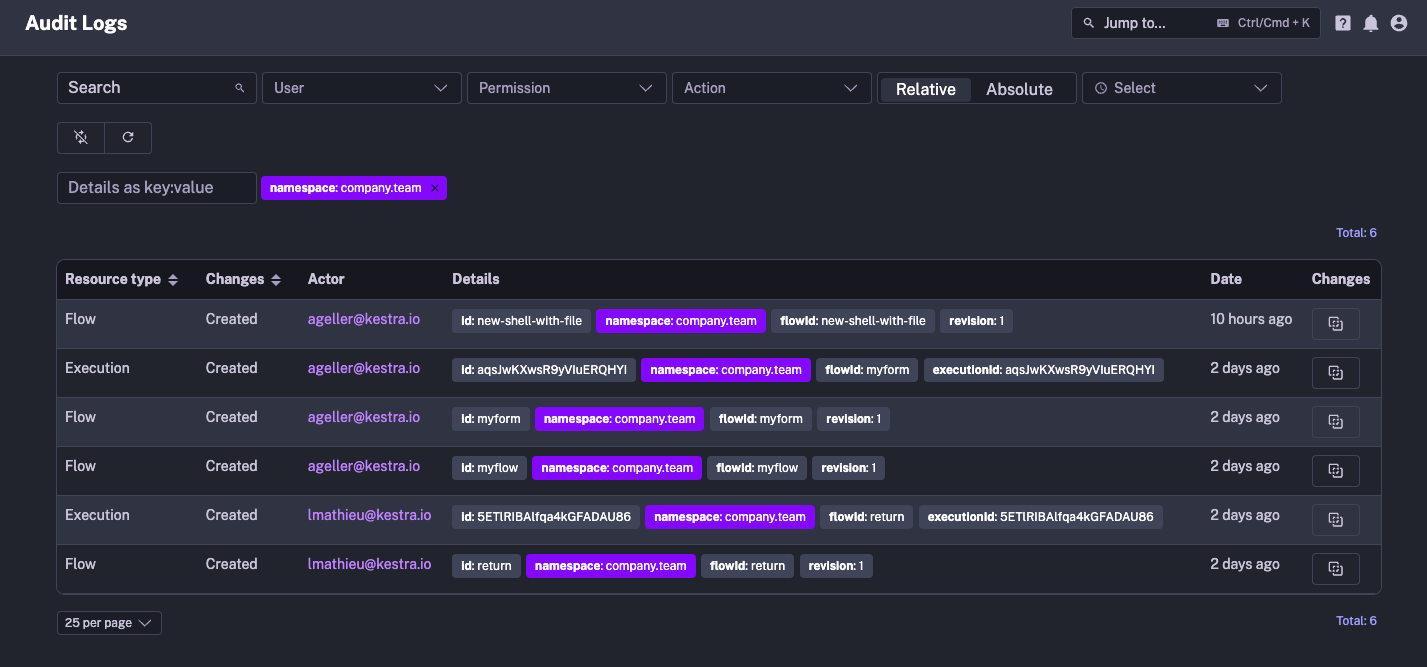
To further filter for a specific event, you can simply click on the relevant tag in the Details column:
How to filter for tenant-specific events
Let's say you want to find out when a specific tenant was created. Simply type "Tenant" in the search bar to filter for events related to when the tenant was created, updated, or deleted.
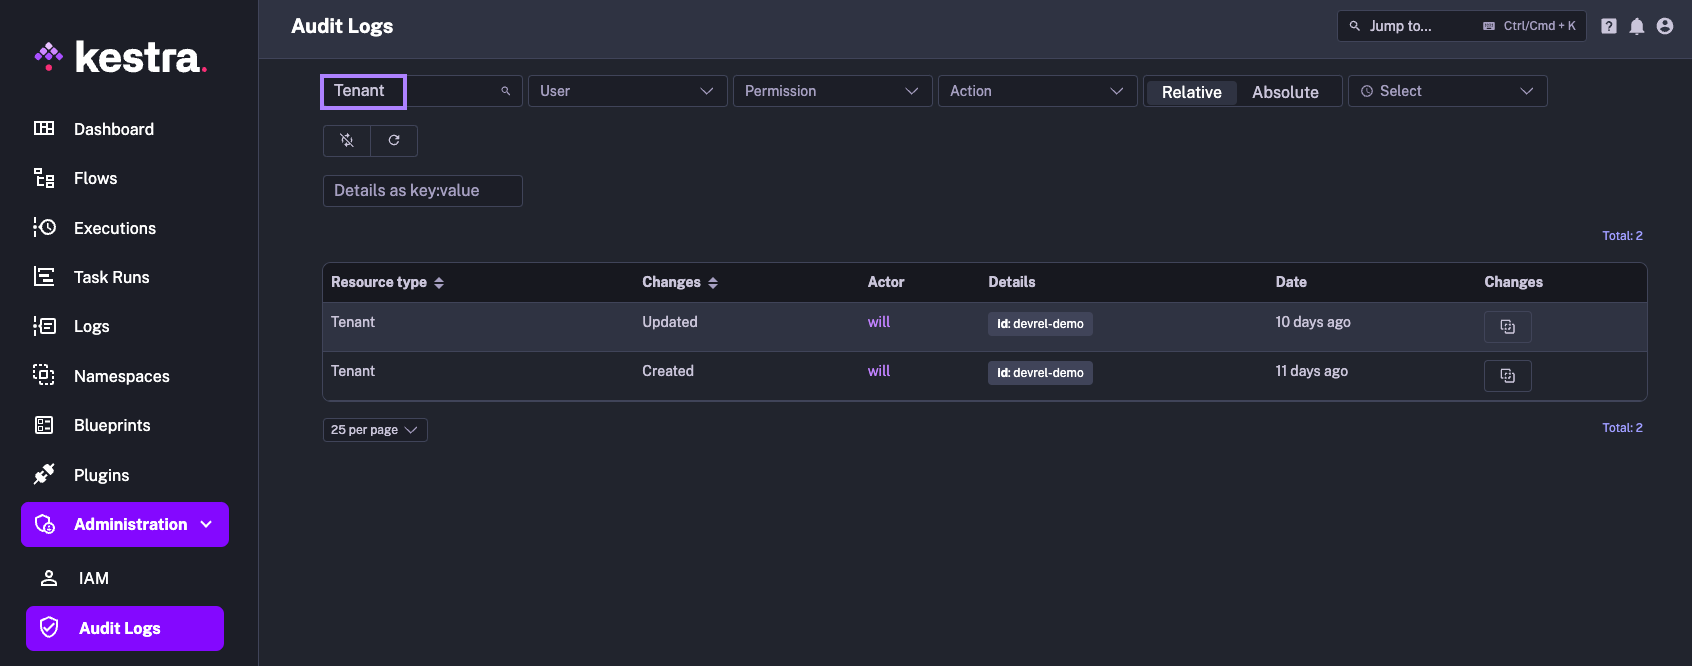
Alternatively, you can explicitly type in the Details filter id:your_tenant_id to filter for events related to that tenant:

Was this page helpful?